
I use page tooltips rarely, but sometimes clients request to see more details in one visual.
In this post, I will show how to create a tooltip page.
I created a demo using Adventure Works Database.
Start by choosing the page you want to be as a tooltip page. It is better to use a new page for this purpose.

Click somewhere on the page >> Visualization >> click on Format page >> page information and allow to use the page as a tooltip. In the Canvas setting, >> select Type as a Tooltip. Then choose vertical alignment by selecting Middle/Top. I like to go with Middle.
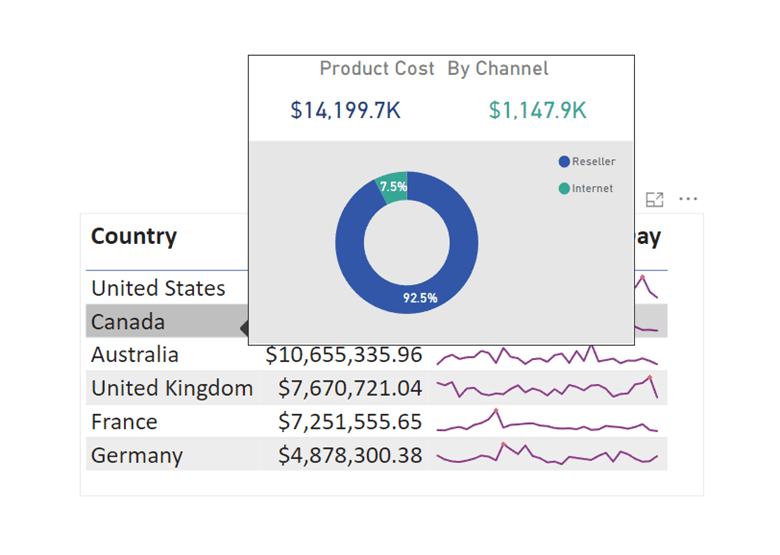
Next, we create all visuals and details that need to be on the tooltip page:

On the main page for the visual that we use the tooltip page on it, select that visual, click on Visualization >> Format Visual >> on the General tab, put Tooltips on >> then in Options drop-down >> in Type, select Report page, and in Page, put the tooltip page name.

And here is the result:
I hope you liked this post. Let me know what you think.

Thanks for sharing.
LikeLiked by 1 person