
Figma is a digital design and prototyping tool. It is a UI and UX design application that you can use to create websites, apps, or smaller user interface components that can be integrated into other projects.
Figma could be used to improve the report design in Power BI.
One of the main improvements in report designs is creating a related background for the report page.
In this post, I created a simple example of background by using this powerful design tool, Figma.
To start with Figma, I created an account using my google account and used that. For more details about it, click here.
As a simple example, I prepared one report page of the Power BI report.

On this page, there are four small visuals and one big visual.
Before starting the creation of the background for this page, we should find the exact page dimension and use that dimension in Figma.
By clicking on the white space of the report page in Power BI then selecting “Format page” in the Visualizations panel, in the “Canvas settings” there is the Height and Width of the report page, ” 1280 * 720″.

Next, open the Figma page and start with “New design file”.

Continue adding “Frame” the same size as the Power BI report page.
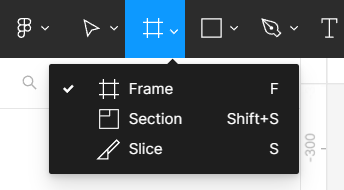

Here, I selected “TV” frame.
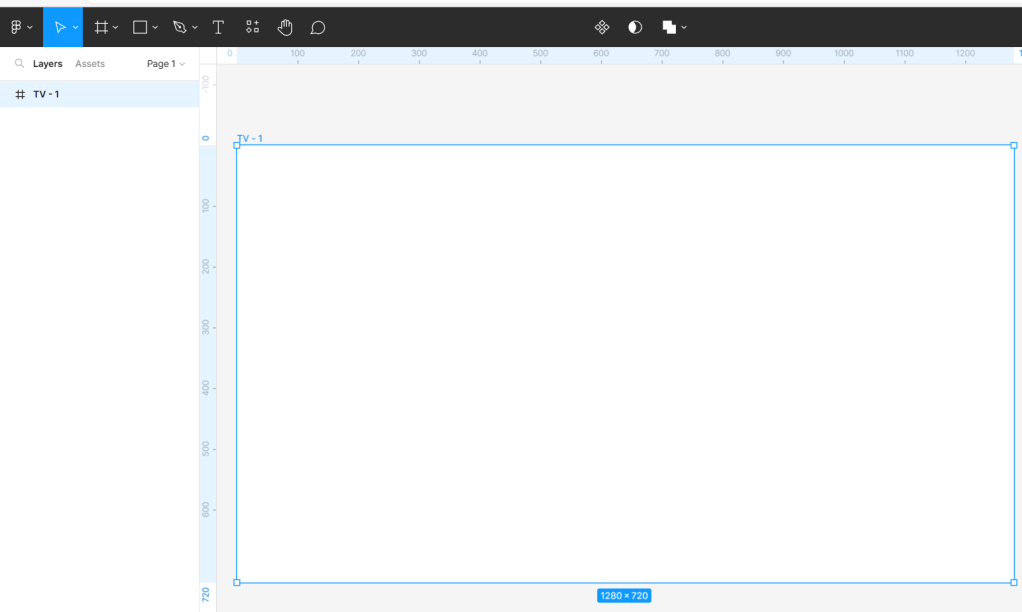
Then, added one rectangle (1280*720) on top of the Frame.
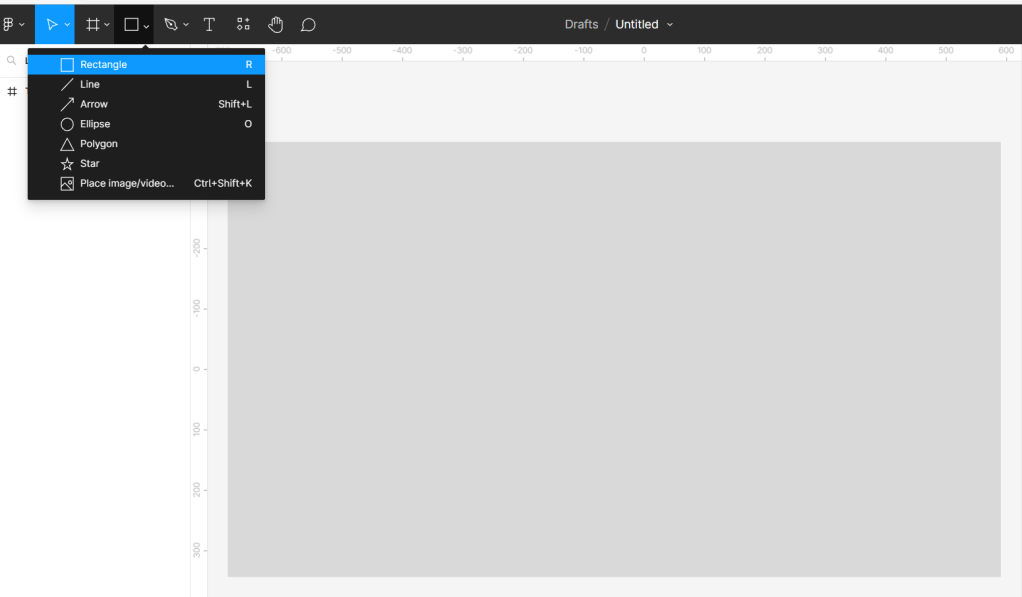
Next, added circles to add colors that I want on top of the rectangle.

Here are the details of this circle filling with the Angular position and adding the colors you need for the report. I used random colors for this example:
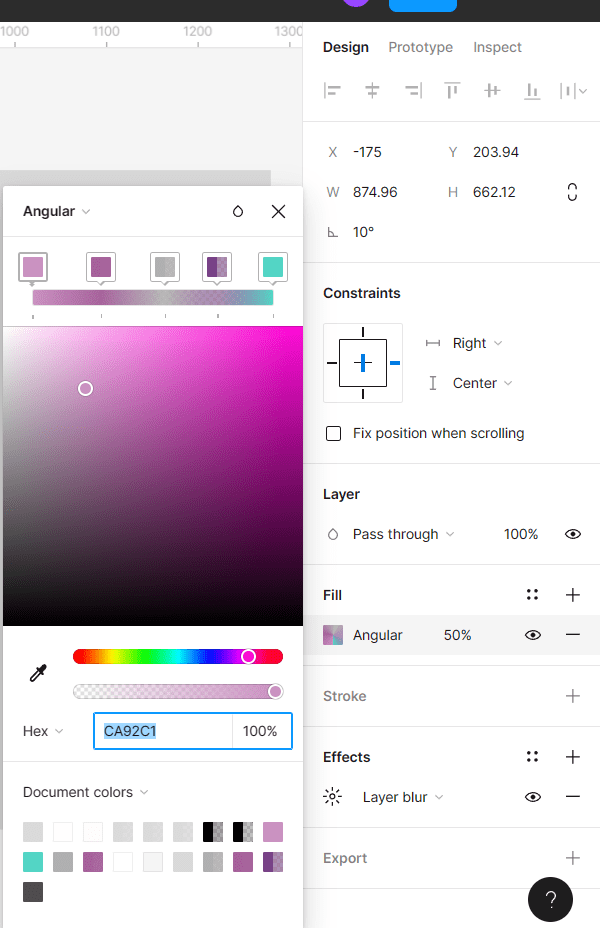
In the “Effects” section, I used “Layer blur” with 200 “Blur”:

Then I copied more circles to fill the rectangle.
Here is the result for the first step of creating the report background:

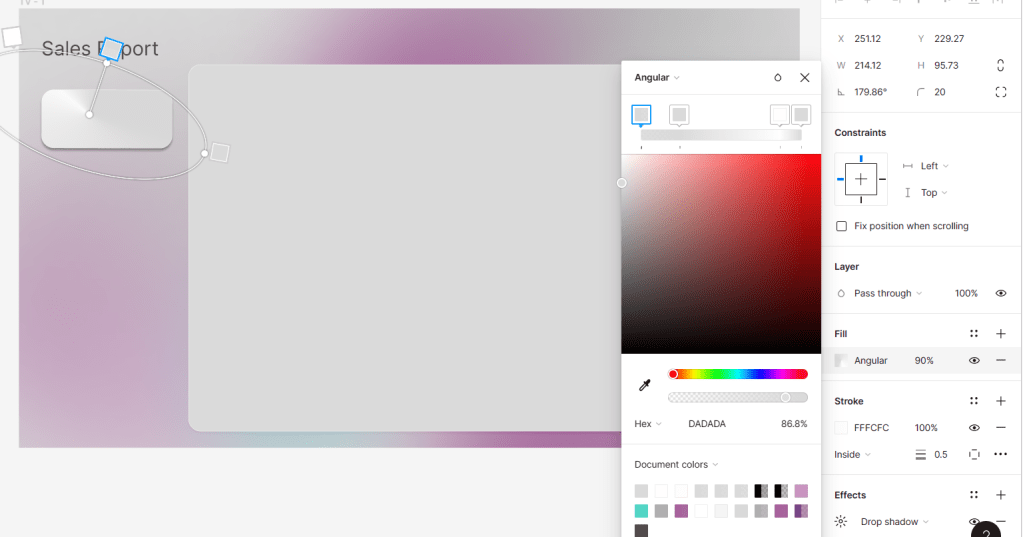
Based on the Power BI report page, there is just one big visual, so I added one big rectangle on top of all steps with four angles curve 20.
Fill it with “grey”, stork set to “white 0.5” and the effect is “Drop shadow”.

Then I added the name of report, “Sales Report”.

I added small rectangle and fill with “Angular” position,

The rest of the setting is the same as a big rectangle.
Then I copied three more of this small rectangle because we have four slicers on our report page:

Then I selected “TV-1” and exported it with the “SVG” format.

Then I added this SVG file as a background for the report page and removed all visual’s backgrounds and borders.
Here is the result:

Did you use Figma before? Which tools you use to design your Power BI reports?
Comment your thoughts.
Check my YouTube video about it:

Thanks for sharing 👍🏻
LikeLike
my pleasure 🙂
LikeLike