
In this post, I will explain how businesses and employers can use Calendar visuals to record the number of employees on leave on specific dates.
Our primary aim is to achieve this result:

I prepared a demo for explaining Calendar visual by creating a table with sample data of employees and their leaving types. Here is a table named “Leaving Employee“:

First Step, I added a Date Table and made the relationship with the “Leaving Employee” Table.
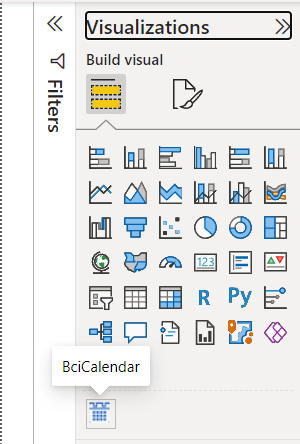
Next, I Imported “Beyondsoft Calendar” visual to the report:

Now, I can see the Calendar visual and click on that to add it to the report page:
Next, I created a measure to calculate the number of employees based on their leaving types.

I Wrote the “if” logical function in the last row of the code because I prefer to see the Calendar visual show up for months that have no records of the employees on leave. Otherwise, the Calendar visual doesn’t show up.
As the “Leaving Employee” table has data mostly from February, I put a screenshot of this month here:

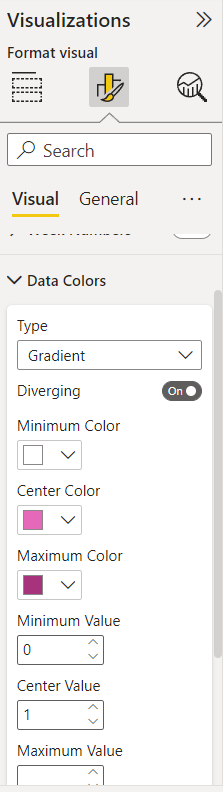
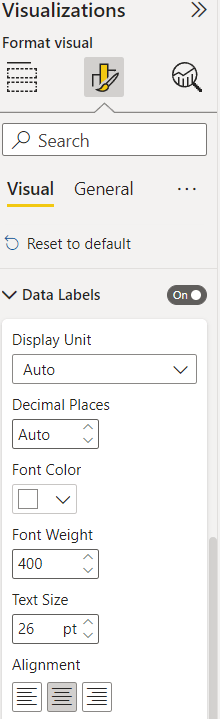
Also, we can set the empty part of the Calendar visual in the Format Visual by selecting Minimum Color in Data Colors same as Font Color in Data Labels. With this setup, we will have a whole year calendar even if there are months without employees on leave.
And now we reached the goal.
I will continue this topic in future posts. Leave your thought in a comment. 👊

مثل همیشه عالی
LikeLiked by 1 person
merci Hossein jan 🙂
LikeLike